
Heating System Emissions
Overview

With recent movements in the building industry towards renewables and ‘green’ products, the electric heating and appliance industry is working towards making a favorable comparison for electric equipment compared to gas-fired equipment. While it is true that electric equipment has no on-site emissions, the same cannot be said for total system emissions when also considering the source of the electric generation.
Major Pollutants
There are 3 Primary ‘Criteria Pollutants’ tracked in all emissions analyses:
- SO2 (Sulfur Dioxide) – pre-cursor to acid rain and environmental pH change to acidic (acid rain issues of the 1970’s)
- NOx (Nitrous Oxides) – pre-cursor to ground level smog and Ozone depletion (ozone hole and issues of the 1980’s)
- CO2 (Carbon Dioxide) Greenhouse Gas, Climate Change indicator (‘new’ Issue of 2000’s)
- In addition to these three, Electric Power Plants are also significant emitters of Mercury and Particulates (Soot) “PM10”
PM 10 Fact Sheet
What is Particulate Matter (PM)
- Airborne particulate matter (PM) consists of many different substances suspended in air in the form of particles (solids or liquid droplets) that vary widely in size.
- The particle mix in most U.S. cities is dominated by fine particles (less than 2.5 micrometers in diameter) generated by combustion sources, with smaller amounts of coarse dust (between 2.5 and 10 micrometers in diameter). The fine particles resulting from the collapse of the World Trade Center (WTC) are largely due to the smoke from combustion of fuels and other combustible materials. The coarse dust in the WTC area is largely due to the removal of building debris and rubble.
- Particles less than 10 micrometers in diameter, that include both fine and coarse dust particles. These particles pose the greatest health concern because they can pass through the nose and throat and get into the lungs.
- Particles larger than 10 micrometers in diameter that are suspended in the air are referred to as total suspended particulates (TSP). These larger particles can cause irritation to the eyes, nose and throat in some people, but they are not likely to cause more serious problems since they do not get down into the lungs.
Source: http://www.epa.gov/wtc/pm10/pm_fact_sheet.html
There is ZERO emission of Mercury with natural gas combustion.
There is no emissions of Particulate Matter with proper combustion of natural gas.
NOTE: Oxygen starvation of the gas flame can result in Carbon Monoxide and Soot formation
Emissions Rates
Electric Emissions Rates: Michigan Averages per eGRID2006 V2.1 (2004 Data)
NOX 2.176 lbs/MWH
SO2 5.930 lbs/MWH
CO2 1,412.673 lbs/MWH
Natural Gas Emissions Rates: EPA-AP42-Natural Gas Combustion
NOX 0.092000 lbs/MMBTU
SO2 0.000584 lbs/MMBTU
CO2 117.000000 lbs/MMBTU
Electric emissions rates are based on MWH produced at the power plants. There are also electric transmission and distribution grid losses that must be considered. This can add another 5 – 10% to account to grid losses.
Natural gas emissions are based on a calculated 100% perfect combustion at the point of use. Since all gas-fired equipment is less than 100% efficient, the emissions factors must be increased by the combustion efficiency of the appliance.
Comparing Heat Pumps and Gas Furnaces
Heat pumps are more than 100% efficient and gas furnaces are less than 100% efficient. Also, MWH and MMBTUs must be converted to common units for an apples-to-apples comparison.
1 MWH = 1,000 kWh = 3,413,000 BTUs at 100% Conversion Efficiency at the point of use
Electric Emissions factors are based on kWh production at the power plant; grid and distribution losses must be added to the point of use
1 MMBTU = 1,000,000 BTUs at 100% Conversion Efficiency at the point of use
Natural gas emissions factors are understood to be calculated to 100% efficiency; therefore, furnace efficiency less than 100% increases the emissions factors linear with actual combustion efficiency.
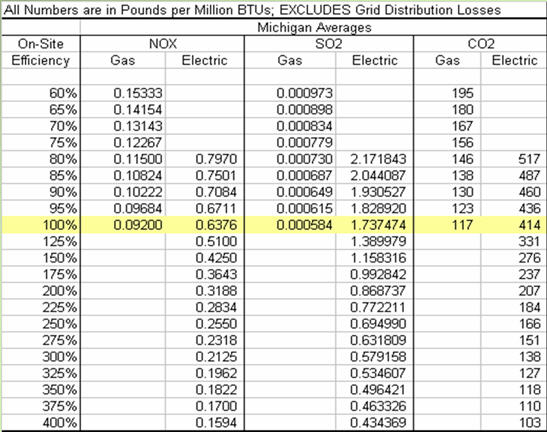
The above Chart calculates emissions rates based on Michigan average state emissions factors from e-Grid and various efficiency of heat pump and gas furnace equipment. Graphically the numbers look like this:
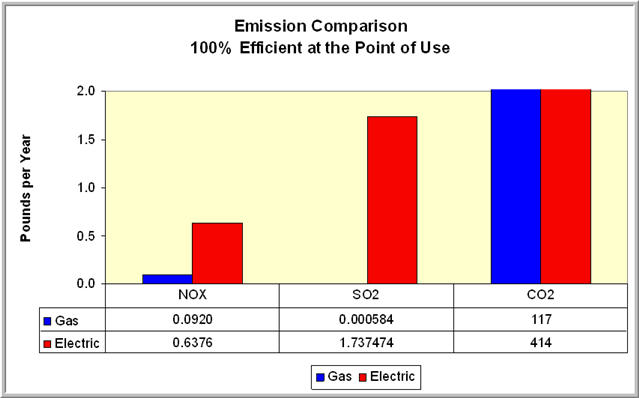
Note that the CO2 is out of scale
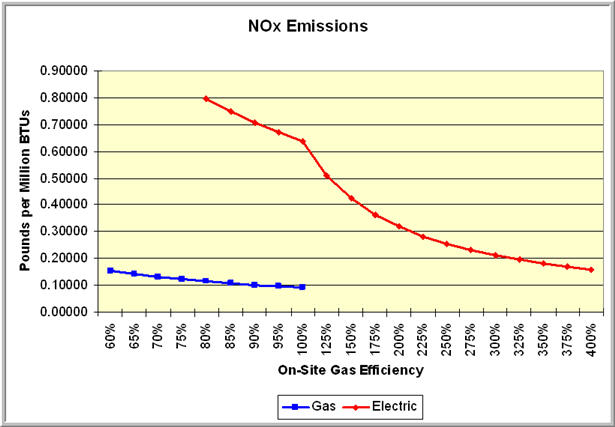
The above Chart shows that it would take a 400% Efficient Heat Pump
to get down to about the same NOx emission as a
60% Efficient Natural Gas Furnace
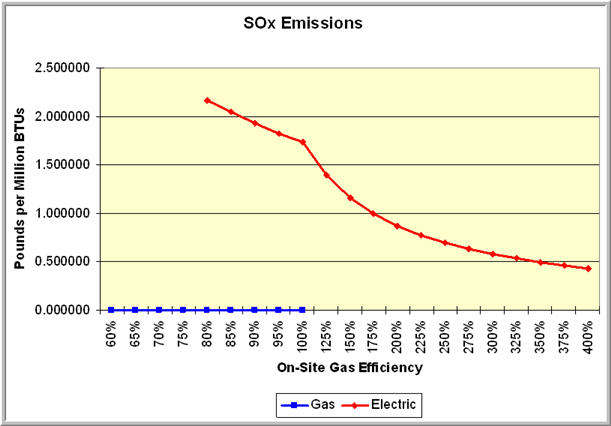
The only sulfur present in pipeline spec quality natural gas is from the Odorant added to it.
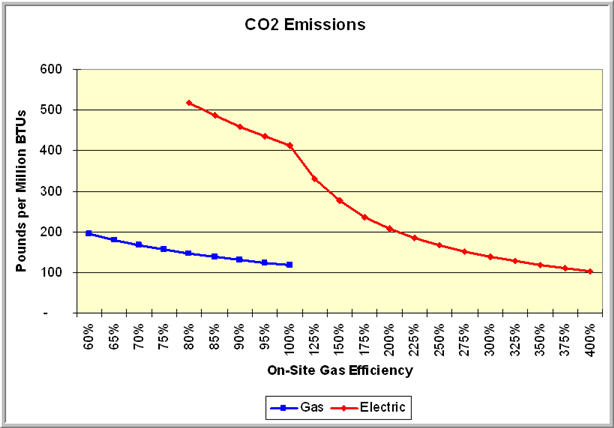
The above Chart shows a close comparison of high efficiency gas furnaces compared with the best geothermal heat pumps,
but even the oldest gas furnaces have lower emissions than air source heat pumps.
The following emissions factors have been extracted from e-Grid data and can be used to calculate results based on other types of electric power plants.
|
Generation Source |
NOx lbs/MWh |
SO2 lbs/MWh |
CO2 lbs/MWh |
|||
| e-Grid Annual Average |
2.100 |
5.44 |
1,363 |
|||
| e-Grid Annual Fossil |
2.830 |
7.47 |
1,869 |
|||
| e-Grid Annual Coal |
3.553 |
9.97 |
2,138 |
|||
| e-Grid Annual Natural Gas |
0.724 |
0.15 |
1,176 |
|||
| Canadian Average ALL 2004 |
1.770 |
5.41 |
846 |
|||
The following example pulls all the numbers together for a 1 – House Comparison; using Michigan average state emissions data and a standard gas furnace with a standard electric geothermal heat pump:
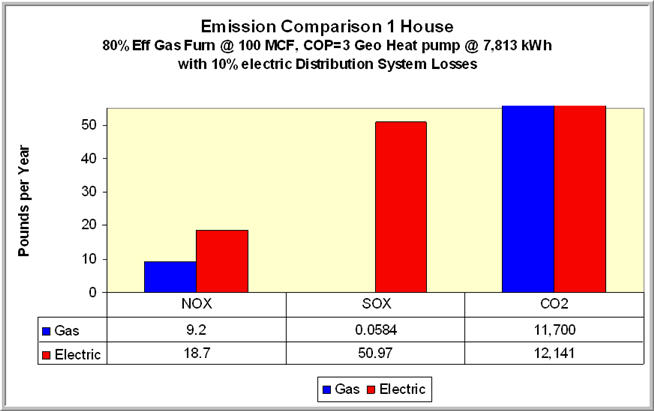
The above Chart clearly shows that there is no environmental advantage
to geothermal heat pumps over natural gas furnaces
using Michigan average state electric power plant emissions data.
Heat Pumps
Geothermal heat pump advocates often claim that a geothermal system is a ‘renewable energy system’ because it uses ground water as its energy source. That is not accurate, as its energy source is electricity. Electricity is used to run a compressor that extracts and compresses low-grade heat from ground water to a more usable, higher temperature. An air-source heat pump is also run by electricity to collect and compress heat from the outdoor air. Neither system is a ‘renewable’ energy source. Renewable energy sources refer to technologies that produce electricity, not consume them.
Heat pumps are the most efficient heating source available at the point of use. There are many variables to factor, but air source heat pumps can be about 200% efficient and geothermal as high as 500% in ideal conditions (claimed by some manufacturers); 300% is more typical in common running applications. This means that when considering their source emissions, heat pumps have a 2 – 5 time advantage over standard electric resistance heating systems, which are typically considered to be 100% efficient.
To estimate the total system emissions including the source of the electricity production, it is necessary to know something about the local electric power grid. Since the grid is interconnected it is impossible to be certain exactly what electricity from which power plant is reaching any one source or area. The emissions data published by e-Grid is organized from major geographic areas, down to regions, states, parent utility companies and individual power plants. In general, areas with a lot of coal-fired power plants will have high emissions and areas with a lot of hydro and nuclear will have much lower emissions factors. The examples I have prepared above are based on Michigan average state numbers; to adjust for any other location, get the correct factors from e-Grid and replace in my examples.
More Information
Electric: eGrid2006, V2.1 (2004 Data)
Spreadsheet database by Region, by State, by Parent Utility Company
http://www.epa.gov/cleanenergy/egrid/index.htm
Natural Gas: EPA AP42
Very limited data combines common types of natural gas combustion
http://www.epa.gov/ttn/chief/ap42/ch01/index.html